Understanding the new Flood Insurance Rate Maps (FIRMs)
The adoption of new Flood Insurance Rate Maps has been well advertised. Commonly referred to as flood maps, these maps represent the delineations of the estimated flood levels during rare and substantial storm events.
The new flood maps depict flood elevations that have never been seen on Cape Cod which in turn results in more properties being located within the flood plain. The costs of flood insurance and the increase in regulatory review will accompany this change.
This page is intended to provide a brief means for people to better understand the available information and is by no means comprehensive. There is a vast network of professionals and a substantial amount of literature available to assist property owners and regulators to better understand the topic.
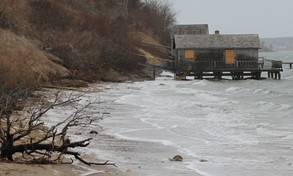
A boathouse in North Chatham during a minor storm event.

An example of a Flood Insurance Rate Map (FIRM).
Reading a Flood Map (FIRM)
The 2014 Flood Maps are relatively easy to read and are substantially more accurate than the previous flood maps. The flood zones are represented by labeled hatches over the 2009 aerial imagery.
The primary zones depicted on the flood maps are VE, AE and X.
The VE and AE Zones are depicted with blue dots and are labeled with the base flood elevations rounded to the nearest whole foot.
The VE Zones are those areas that will not only flood but will endure wave action.
The AE Zones are those areas that will flood and endure minimal to moderate wave action. The limits of the moderate wave action are noted where applicable.
The X Zones are those areas where flooding is minimal or unlikely. The shaded areas are those where flooding of less than one-foot can be expected during a storm event. The remainder of the Zone X is the area with the least likely chance for a flood.
FEMA Filings
Elevation Certificate – A certified document that lists the elevations of and adjacent to a building that is used to determine flood insurance rates.
LOMR – A Letter of Map Revision augments the Effective FIRM based on a study that recalculates the flood elevations in a given area based on a natural or manmade physical change.
LOMA – A Letter of Map Amendment augments the Effective FIRM based on a survey that verifies that the subject property is not within the floodplain.
Important Dates
• July 16, 2014 – The maps for Barnstable County were officially made effective by FEMA.
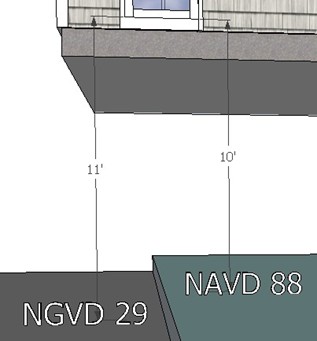
Vertical Datum (Zero)
A vertical datum is the zero used to determine elevations. Historically, datums have been based on sea level. Unfortunately, sea level is not at the same level across the world and is not fully stable.
In 1929, the Federal Government established the Mean Sea Level Datum (MSL). By 1973 the observed changes in Sea Level combined with other issues led to this datum being renamed the National Geodetic Vertical Datum of 1929 (NGVD).
In 1988, the Federal Government established the North American Vertical Datum of 1988 (NAVD). This new datum varies from its predecessor by a varying amount depending on location.
The previous Flood Maps were based on the older datum (MSL, NGVD) and the 2013 Flood Maps are based on the newer datum (NAVD). The elevations listed on maps, plans, certificates or other documents that are on the older datum need to be adjusted or measured again to convert the values to the new datum.
Across Cape Cod, the conversion from the old datum to the new is about one foot. If a house is at elevation 14 NGVD, it is now at elevation 13 NAVD.
Please note that the conversion is not uniform across Barnstable County. The quality of a reported elevation is only as good as the benchmark upon which it was based. Unfortunately, the datum change will appear to add another foot to properties that were previously surveyed.